

At Yottron Solutions, we excel in transforming complex datasets into visually engaging and easily interpretable charts, graphs, and dashboards. Our data visualization solutions are designed to help businesses make data-driven decisions with confidence. Our team leverages state-of-the-art visualization tools and techniques to create interactive and dynamic visual representations of your data. Whether you need real-time data dashboards, custom reports, or advanced analytics visualization, we have the expertise to deliver. Unlock the full potential of your data with Yottron Solutions and turn insights into impactful business actions through compelling visual storytelling.
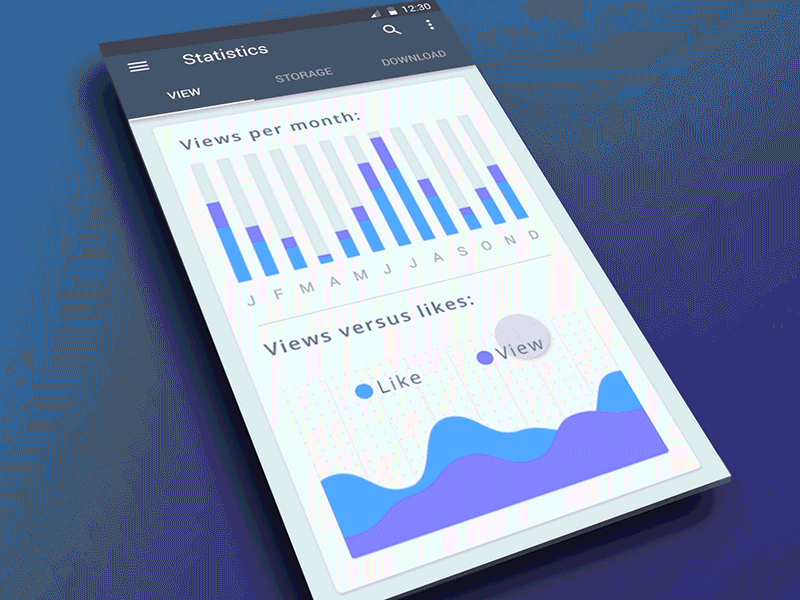
Creating interactive and user-friendly dashboards that provide real-time insights and enable data-driven decision-making.

Designing custom reports that are tailored to your specific business needs, offering clear and actionable insights.
Integrating data from multiple sources to provide a comprehensive view, ensuring your visualizations are based on accurate and complete data.

Implementing real-time analytics to deliver up-to-the-minute insights, enabling you to respond swiftly to changing business conditions.

Crafting compelling data stories that communicate complex information in a clear and engaging manner, helping you convey your message effectively.

Ensuring the security of your data throughout the visualization process, with robust measures to protect sensitive information.

Leveraging cloud platforms like AWS, Azure, and Google Cloud to deliver scalable and cost-effective data visualization solutions.

Utilizing advanced analytics techniques, including machine learning and AI, to uncover deeper insights and drive innovation.
During this phase, we analyze your data requirements, goals, and constraints to define the scope and objectives of the data warehousing and data lakes project.
This phase involves creating a comprehensive integration plan, including strategies, resources, schedules, and risk assessment, based on the analysis conducted in the previous phase.
In this phase, detailed data models, schemas, and data flow diagrams are designed to cover all aspects of the data warehousing and data lakes architecture.
During data ingestion, the prepared data pipelines and scripts are executed to load data into the warehouse or lake, ensuring the data meets the required quality and consistency standards.
Once data is ingested, it is validated, cleansed, and transformed to ensure accuracy, completeness, and reliability. Detailed reports help in understanding and addressing any data quality issues.
After successful data integration and quality assurance, the project closure phase involves summarizing and analyzing the entire process, ensuring all objectives are met and the data is ready for analysis and utilization.